JEPA / Surprise
NeurIPS 2026 workshop · World Models in Physical AI

When Does Latent Prediction Error Support Physical Surprise Claims in Video World Models?

Anton Hristov1,* Aleksandar Slavov2,* Vasil Vasilev1,*

1 Technology School Electronic Systems (TUES)2 Baba Tonka High School of Mathematics

* Equal contribution

Abstract

Prediction errors from video world models are often treated as physical surprise, but they can also reflect appearance, static content, motion, or ordinary prediction difficulty. We present an evaluation framework that separates what frozen representations contain, how they organize appearance and physical differences, and what changes a model's own prediction error. On IntPhys2, a benchmark of physically possible and impossible events, we compare representations from latent prediction, masked pixel reconstruction, and simple visual statistics. Appearance remains easy to decode, while V-JEPA2 exposes modest information about whether events are possible or impossible. Looking at the latent geometry, appearance changes become smaller compared with differences between videos, their directions line up more consistently across scenes, and their overlap with physical changes decreases in deeper layers. Across action-conditioned models, incorrect actions raise prediction error, while appearance changes also produce substantial responses. In Physion++ video clips, repeating a single frame can produce higher error than the original clip, while changing color throughout the clip can lower it. Using Kubric, a simulation and rendering framework, we find that impossible events can produce lower error than possible events. A fixed error threshold also incorrectly flags many possible events as impossible. A model can therefore represent physical information and respond to incorrect actions without its native prediction error reliably measuring physical surprise.

Evaluation framework

What we evaluate

01 / Readouts

Physical-label classification

We train linear classifiers on frozen IntPhys2 features to distinguish possible from impossible events. Pooling all four appearances, classification is more accurate with V-JEPA2-G than with VideoMAE2-G or simple visual statistics. This tests whether label information can be read out; we test prediction error separately.

Five-fold scene cross-fit · 57 scenes · Post-hoc corrective analysis
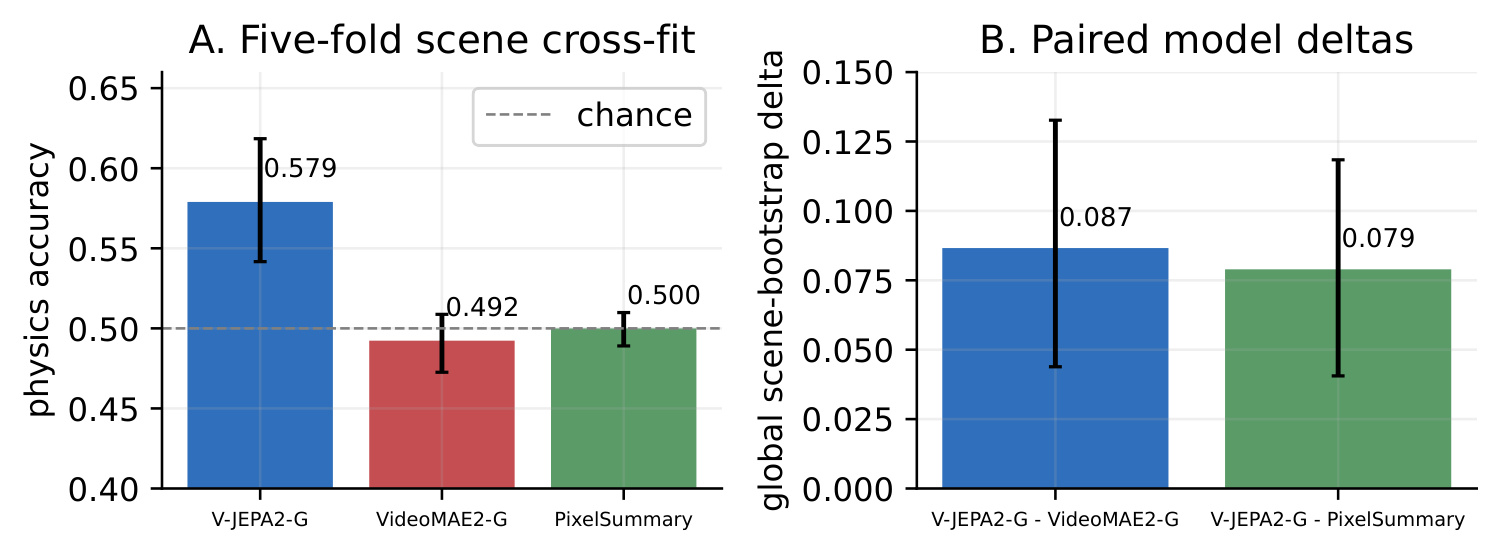
V-JEPA2-G physics classification accuracy is 0.579, versus 0.492 for VideoMAE2-G and 0.500 for PixelSummary; paired differences are positive.
Accuracy on scenes excluded from classifier training, and V-JEPA2-G minus each comparison. Intervals resample scenes with predictions held fixed. Figure 4.
Appearance labels and evaluation details

Appearance labels remain easy to recover. V-JEPA2-G's four-class appearance accuracy is approximately 98%, but appearance and physics classification do not provide a common scale for the amount of information encoded.

Five-fold scene cross-fitting keeps each scene's pairs and appearances together. The linear classifiers use class balancing and feature scaling fitted only on training data. The intervals condition on the fitted classifiers; they omit uncertainty from refitting them or changing the fold assignment.

Architecture and training differ across models, so the comparison covers the released representations as a whole and does not isolate the JEPA objective.
02 / Geometry

Appearance and physical changes across layers

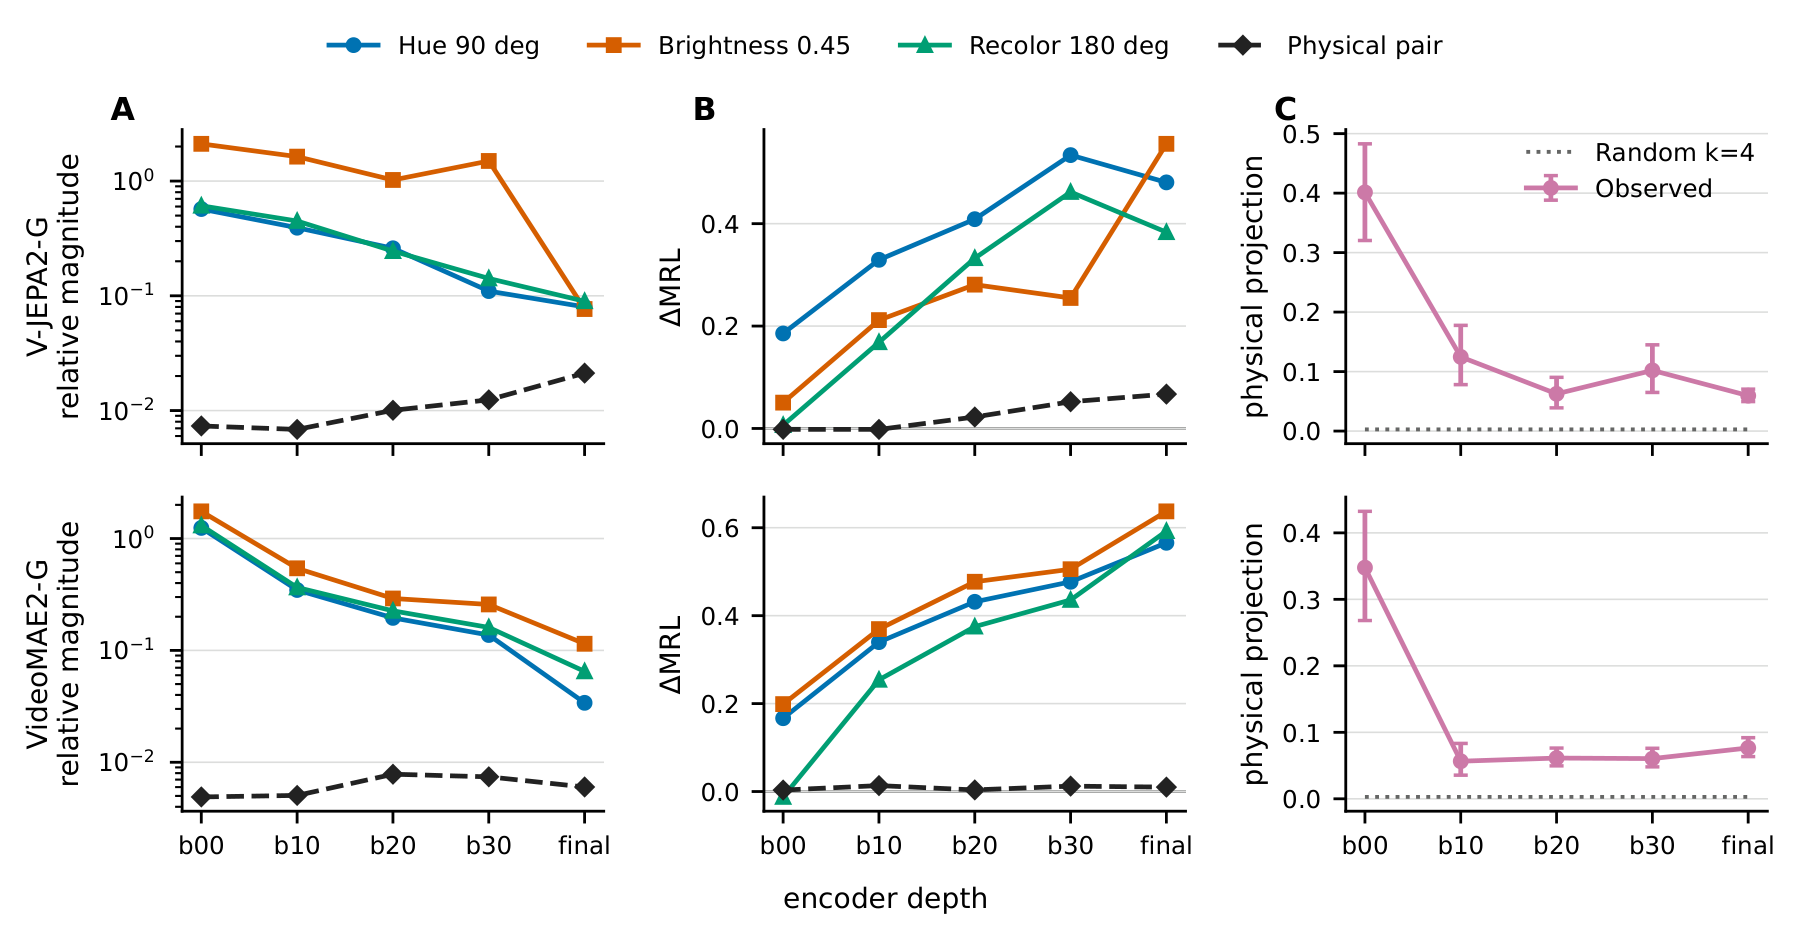
We measure the size of appearance shifts relative to differences between unrelated videos. We also measure how consistently the shifts line up across scenes, and how much physical differences overlap with an appearance subspace fitted on other scenes. Final overlap is lower than initial overlap, but the trajectory is not monotonic.

Layerwise geometry in V-JEPA2-G and VideoMAE2-G: relative appearance displacement, directional coherence above shuffled pairs, and physical displacement projected into an appearance subspace.
Left: shift size relative to unrelated-video distance. Middle: alignment above shuffled video pairings. Right: overlap with the appearance subspace, compared with a random subspace of the same dimension. Figure 2.
Geometry and prediction error

We also test whether geometric measurements predict error differences in the crossed-support setting. Linear regressions fitted on 24 separate configurations predict physical margins (impossible minus lawful error) and appearance-induced score changes on the 256-configuration test population. The baseline uses condition labels and simple visual statistics; the expanded model adds relative feature distances and their interactions with support or appearance timing.

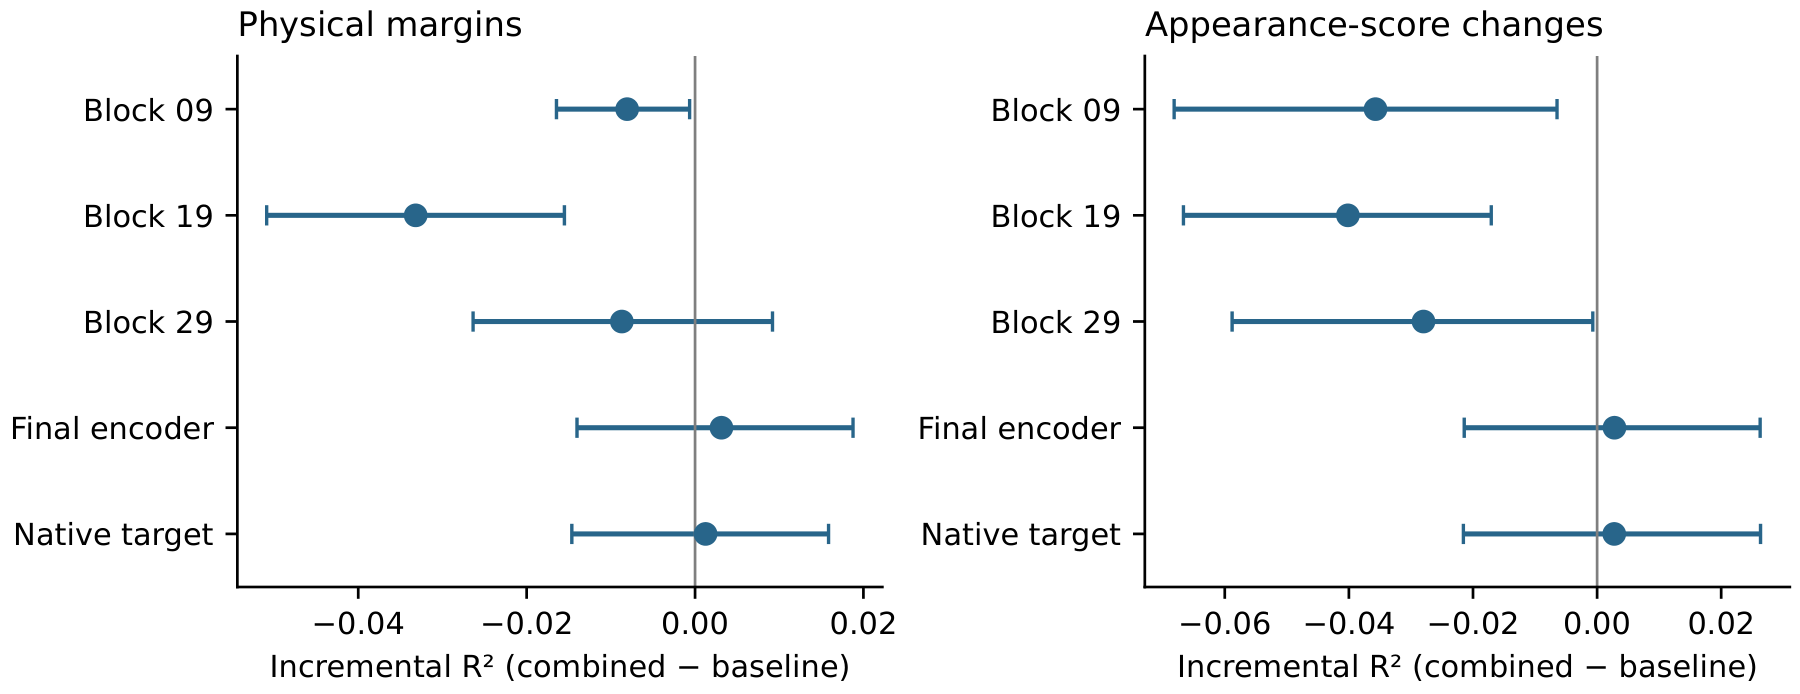
Adding final-encoder geometry changes physical-margin R² from approximately 0.771 to 0.774, but the adjusted improvement interval includes both gains and losses. Some earlier locations worsen prediction. Here R² uses the error of predicting the fitting-set mean as its reference. For appearance-score differences, both models perform worse than that reference.

Combined-minus-baseline R squared across five geometry locations and two tasks; none of the adjusted improvement intervals lies entirely above zero.
Post-hoc analysis of all five fixed geometry locations and both tasks. Bars show 99.5% configuration-bootstrap intervals, conditional on the fitted regressions. Figure 12.

This analysis gives limited evidence of added predictive value from the tested features and linear models. Native prediction error is the world model's discrepancy between predicted and observed features; the regression error measures how well a separate model predicts differences in that discrepancy.

03 / Prediction error

Action and appearance sensitivity

We compare predictions made with correct and incorrect actions for the same observed outcome. We also change color while holding the simulated physical state fixed. Both changes affect LeWorldModel's prediction error.

Physion++ uses repeated-frame and clip-wide color controls. Its scorer encodes the full clip before selecting context tokens, so target frames can affect the predictor's input. Repeating one frame also changes both content and history, so it does not isolate the causal effect of motion.

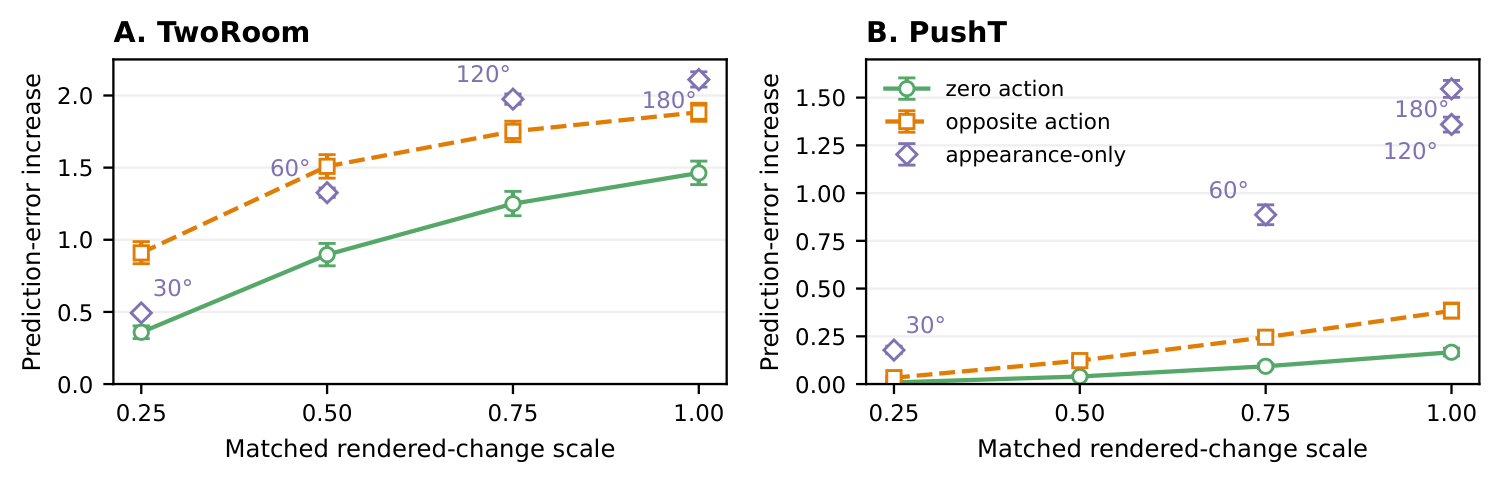
LeWorldModel error increases under mismatched actions and hue changes in TwoRoom and PushT.
Action points compare incorrect and correct actions for the same outcome. Hue points compare recolored and unchanged static targets. Scores use each task's native latent mean squared error (MSE). Figure 3.
More action and color results

Color choices in PushT

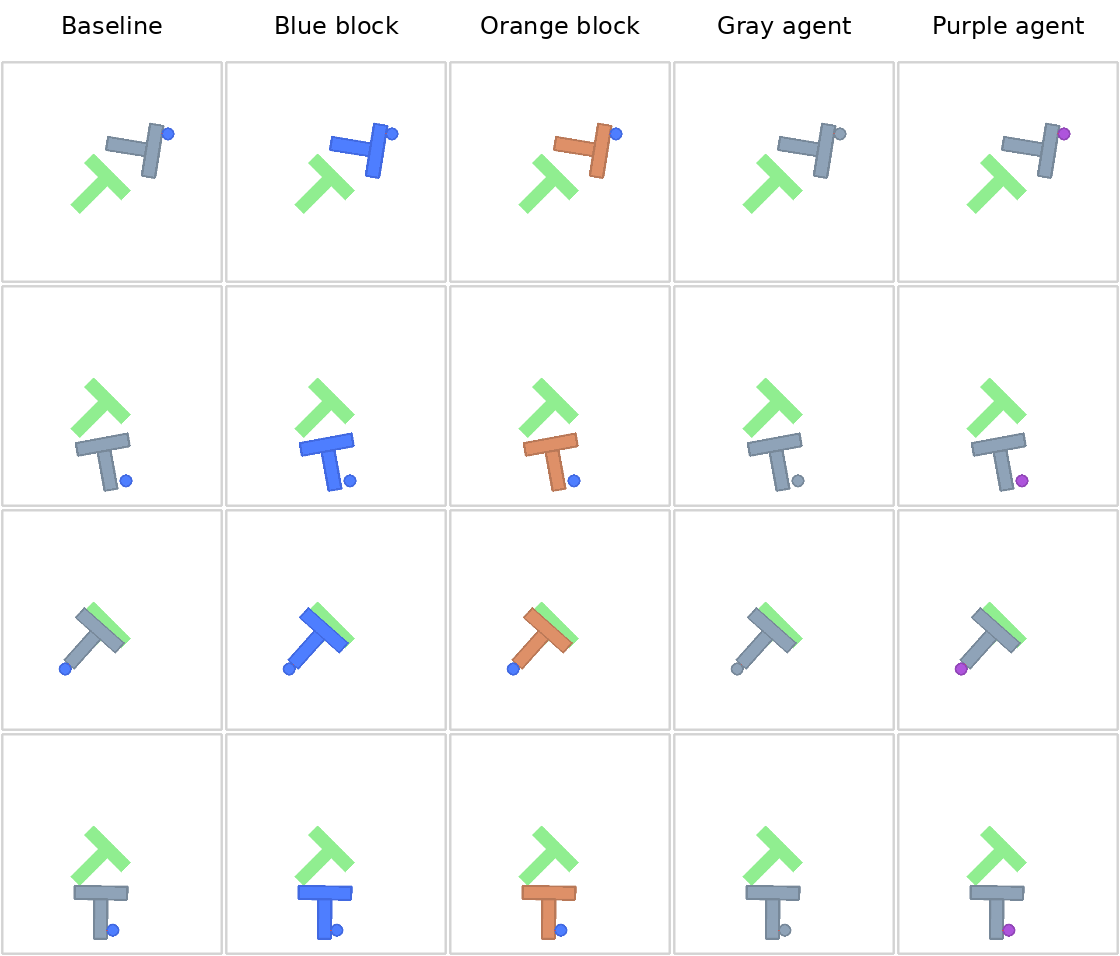
In a separate study with simulator state fixed and RGB change matched, LeWorldModel's error still depends on color choice. Agent-blue blocks score higher than novel-orange blocks; block-gray agents likewise exceed matched purple. The target-only blue/orange gap is positive in 233 of 256 episodes. Persistent changes reduce the mean gaps but retain both orderings.

Four fixed PushT states, each shown with the baseline, a blue or orange block, and a gray or purple agent; object positions stay unchanged across each row.
Each row holds simulator state fixed. Columns show the paired renderer baseline, an agent-blue block, a matched orange block, a block-gray agent, and a matched purple agent. Figure 7.

For target-only edits, the prediction is unchanged and differences in target-encoder shifts account for almost all of the score gaps algebraically. Role colors can carry task information. These controls leave open whether that information helps predict physical outcomes or whether LeWorldModel encodes task roles.

Comparing actions and colors

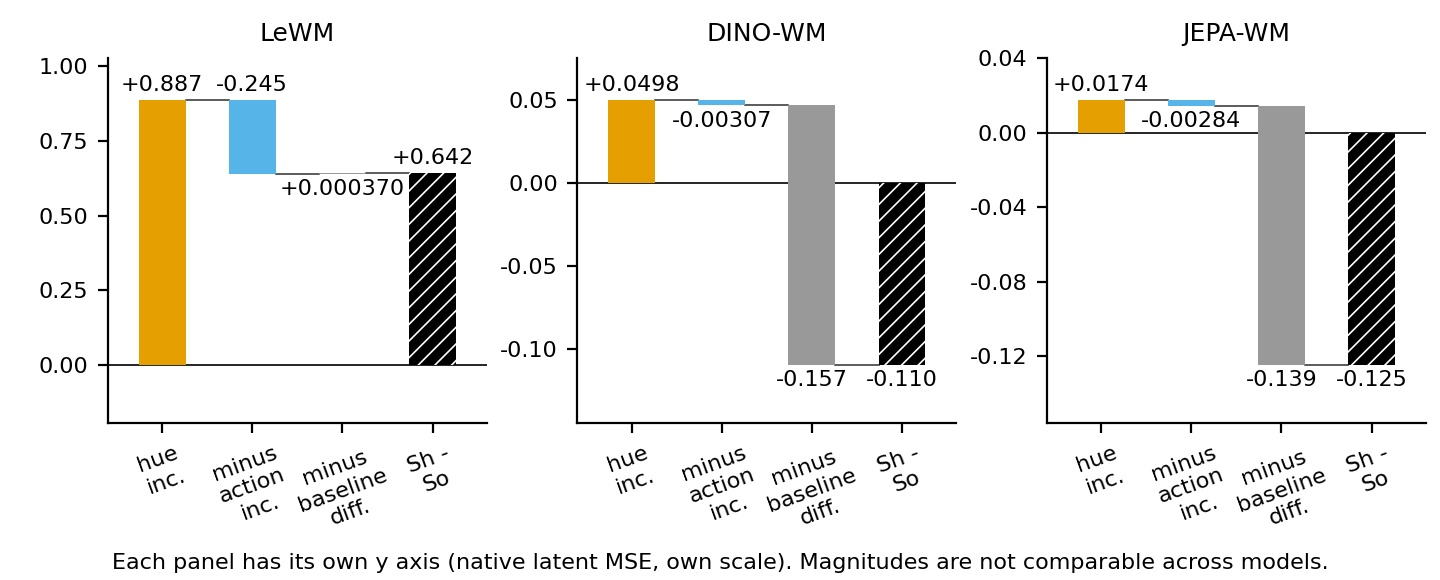
At the 60° hue and 0.75 action-scale PushT match, the mean hue increase exceeds the mean action increase for LeWorldModel, DINO-WM, and JEPA-WM. For DINO-WM and JEPA-WM, however, the moving lawful targets already have higher error than the static ones. Comparing absolute scores can therefore rank the action change above the hue change even though the hue increase over its own baseline is larger.

Waterfall plots for LeWorldModel, DINO-WM, and JEPA-WM separate the hue increase, action increase, and moving-versus-static lawful baseline difference.
Descriptive decomposition of stored means over 256 episodes per model. Each model uses its own native latent-MSE scale; magnitudes are not comparable across models. Figure 6.
Still frames and clip-wide color changes

We evaluate V-JEPA2-L's full-clip masked-prediction score on the 192 official Physion++ Mass videos. The still-frame controls have higher mean error than the original videos. Across videos, the mean share of windows scoring no higher than their average static baseline is approximately 84%. Windows are averaged within videos; uncertainty uses matched pairs within each scenario, not independent windows.

A separate experiment uses one fixed middle 16-frame window per video. Persistent hue shifts and pixel darkening both lower mean error relative to the original and to their target-only counterparts. Each table entry subtracts the second condition from the first: negative means lower error, not a negative error score.

Appearance contrasts on 96 matched pairs
ContrastHuePixel darkening
Persistent minus original-0.00312 [-0.00385, -0.00236]-0.00270 [-0.00337, -0.00203]
Target-only minus original-0.00069 [-0.00168, +0.00021]+0.00059 [-0.00038, +0.00158]
Persistent minus target-only-0.00243 [-0.00337, -0.00134]-0.00329 [-0.00415, -0.00242]

Brackets are 99.17% pair-bootstrap intervals adjusted for six comparisons. Persistent changes affect the whole window; target-only changes affect its final four frames. The persistent-versus-target-only hue ordering reverses in Collision, so the overall mean does not describe every scenario. Table 2 in the paper.

A physical-validity control

Physical validity with and without support

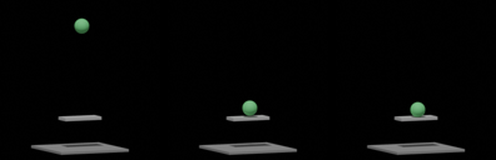
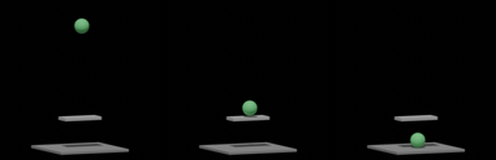
On solid support, stopping is lawful and falling through is a violation. With a gap, falling is lawful and stopping unsupported is a violation.

Stops

Lawful
With solid support, the sphere stops on the platform: a lawful continuation.

Falls

Violation
With solid support, the sphere falls through the platform: a physical violation.

Example frames from the 24-configuration development set. Figure 8.

Prediction error in the two settings

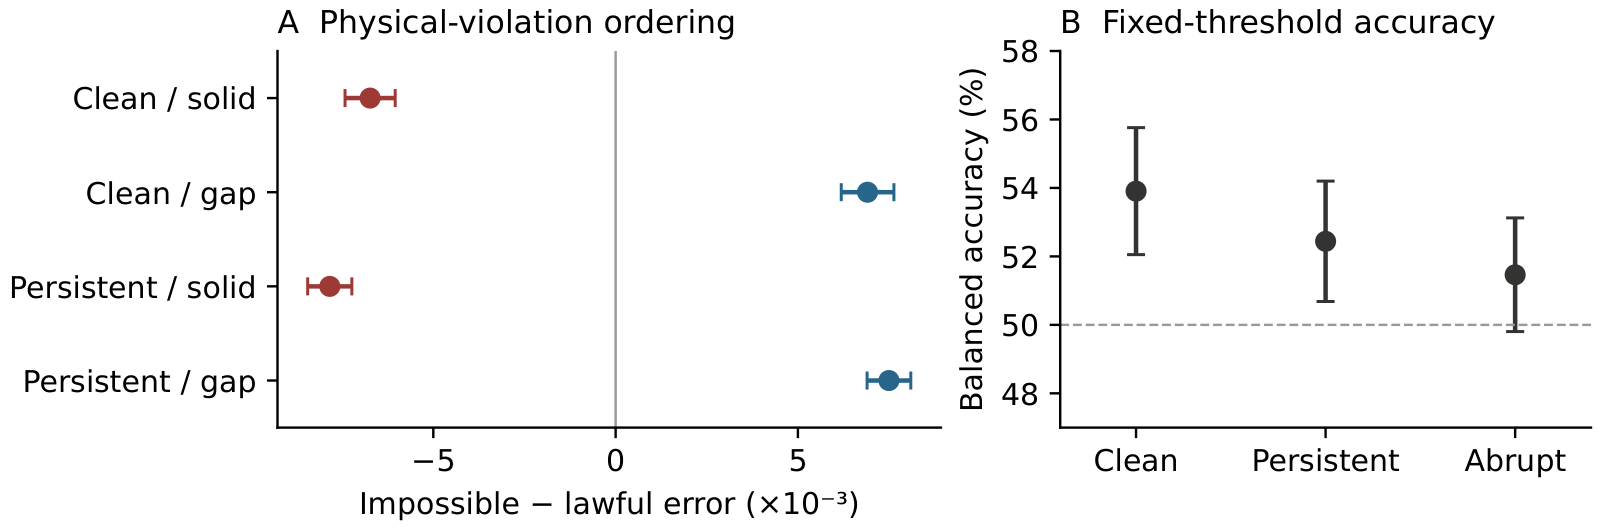
On 256 independent test configurations, V-JEPA2-G gives stopping higher mean error than falling in both settings, so impossible events do not consistently receive higher error. A single error threshold chosen on separate development data also flags many lawful test events as impossible.

Impossible-minus-lawful error is negative with solid support and positive with a gap; fixed-threshold balanced accuracy is near 54 percent on clean clips.
Left: mean error on impossible clips minus mean error on lawful clips, with adjusted intervals. Right: balanced accuracy with descriptive intervals. Figure 1.
Trajectories and threshold errors

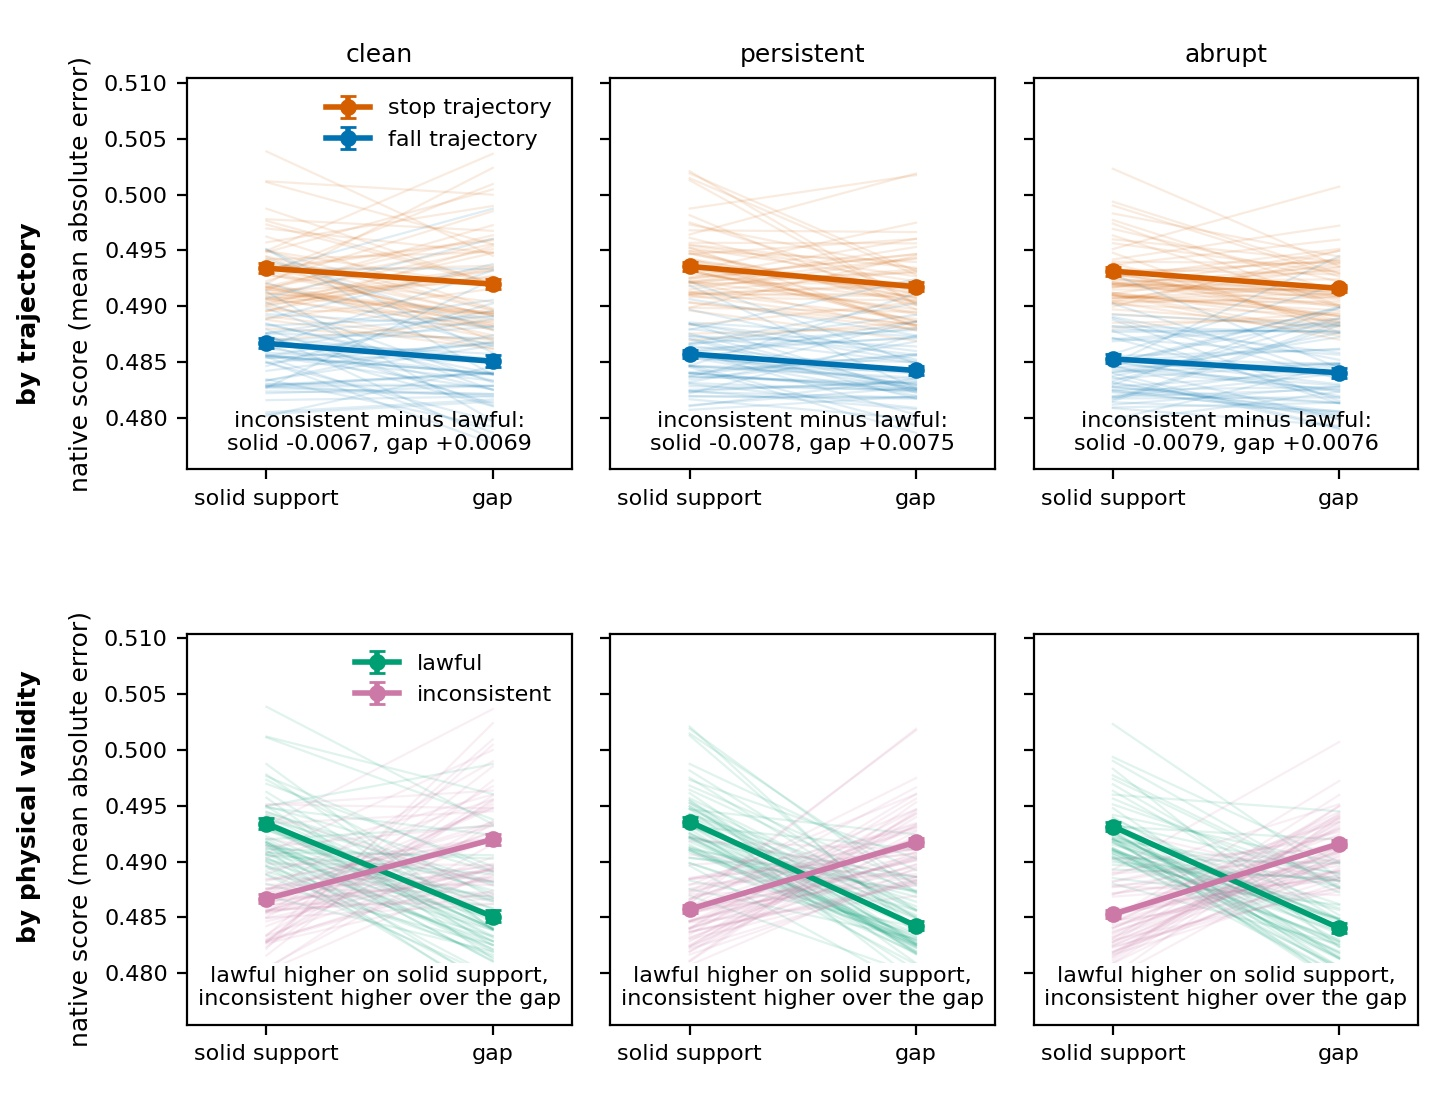
Within each setting and appearance, the two continuations share context frames and predictor outputs. Support appearance, shadows, and occlusion differ across settings. Crossing the four cases with original, persistent-hue, and abrupt-hue appearances gives 3,072 clips. The hue shift is 30°, applied throughout the clip or starting at the target interval. The predictor observes the first 12 of 48 frames; error is mean absolute difference from normalized target features for the remaining 36 frames.

Scores grouped by stopping and falling above, and lawful and impossible events below; trajectory ordering stays the same while physical-validity ordering reverses.
Thick lines average all 256 test configurations; faint lines show a fixed display subset of 60. Error bars are descriptive 95% configuration-bootstrap intervals, not the primary adjusted margin intervals. Figure 9.

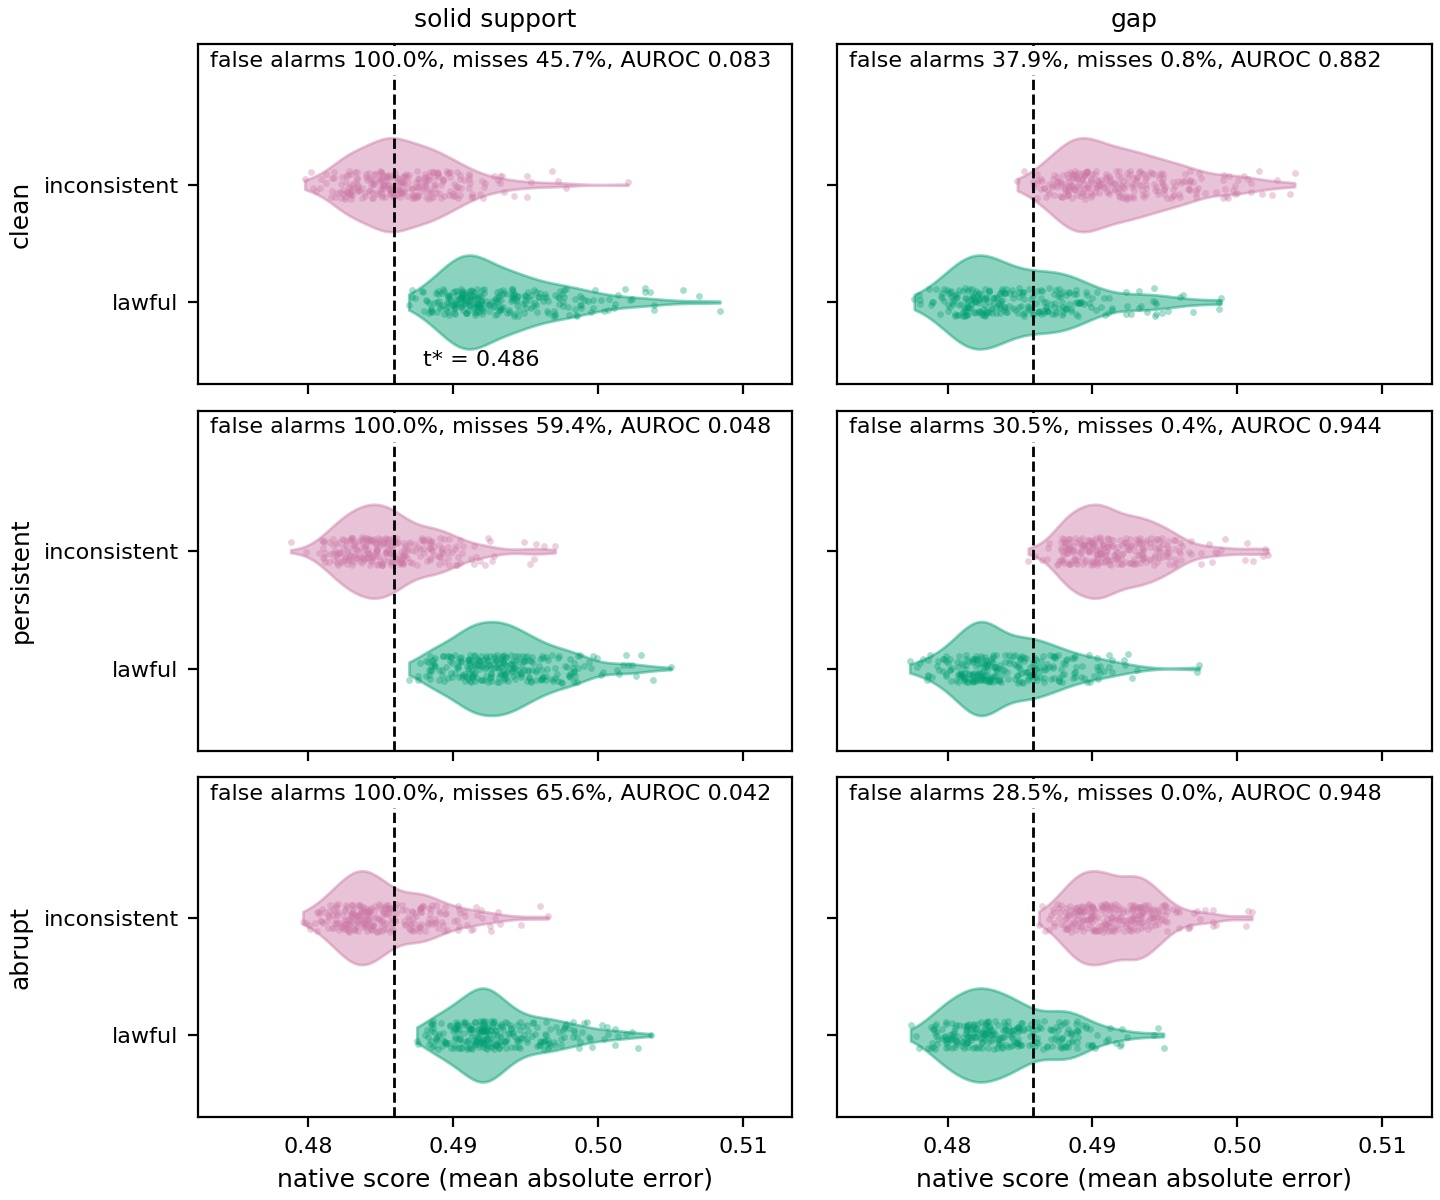
The single threshold falsely flags about 69% of lawful clean clips, including every lawful solid-support stop. Clean balanced accuracy differs sharply by setting: 80.7% over gaps versus 27.1% on solid support. An above-chance average can therefore coexist with a large false-alarm rate.

Lawful and impossible score distributions under one development threshold, for clean, persistent-hue, and abrupt-hue clips in both support settings.
The dashed line is the unchanged development threshold. Each class contains one score from every test configuration; vertical jitter is for display only. Violins show smoothed densities, not confidence intervals. Figure 10.

Reproducibility

Code and experiment records

Datasets, model weights, rendered videos, and large feature caches must be obtained separately. The execution instructions specify the required input files, software versions, and hardware.

Citation

@article{hristov2026physicalsurprise,
  title={When Does Latent Prediction Error Support Physical
         Surprise Claims in Video World Models?},
  author={Hristov, Anton and Slavov, Aleksandar and Vasilev, Vasil},
  journal={arXiv preprint arXiv:2611.01815},
  year={2026},
  doi={10.48550/arXiv.2611.01815},
  url={https://arxiv.org/abs/2611.01815}
}